Word cloud (aka tag cloud) plot
cloud.Rdcloud creates a siple word cloud plot
cloud(w, col, yspace=1.3, xspace=0.01, minh=0, ...)Arguments
- w
named weights - the acutal data to display. Names are used as tags, actual weight is used for the size. Note that plotting an unnamed vector results in an empty plot.
- col
color for the tags.
- yspace
space between lines as a multiple of the text height.
- xspace
space (padding) between tags (in native coordinates).
- minh
minimal height of a line.
- ...
optional arguments, currently ignored.
Value
Invisible TRUE.
Details
The coordinates of the plot are [0, 1] in both x and y. The plot is created by starting in the upper left, proceedeing from left to right and top to bottom. The algorithm used is simply filling up
Note that resizing a world could usually destroys its
properties. You'll have to re-run cloud after resizing,
because it relies on exact extents of the text.
Examples
# a really silly one
words <- c(apple=10, pie=14, orange=5, fruit=4)
cloud(words)
 #> Warning: argument 1 does not name a graphical parameter
# or with more words - take the license for example
r <- paste(readLines(file.path(R.home(),"COPYING")), collapse=' ')
r <- gsub("[\f\t.,;:`'\\\"\\(\\)<>]+", " ", r)
w <- tolower(strsplit(r, " +")[[1]])
cloud(sqrt(table(w)))
#> Warning: argument 1 does not name a graphical parameter
# or with more words - take the license for example
r <- paste(readLines(file.path(R.home(),"COPYING")), collapse=' ')
r <- gsub("[\f\t.,;:`'\\\"\\(\\)<>]+", " ", r)
w <- tolower(strsplit(r, " +")[[1]])
cloud(sqrt(table(w)))
 #> Warning: argument 1 does not name a graphical parameter
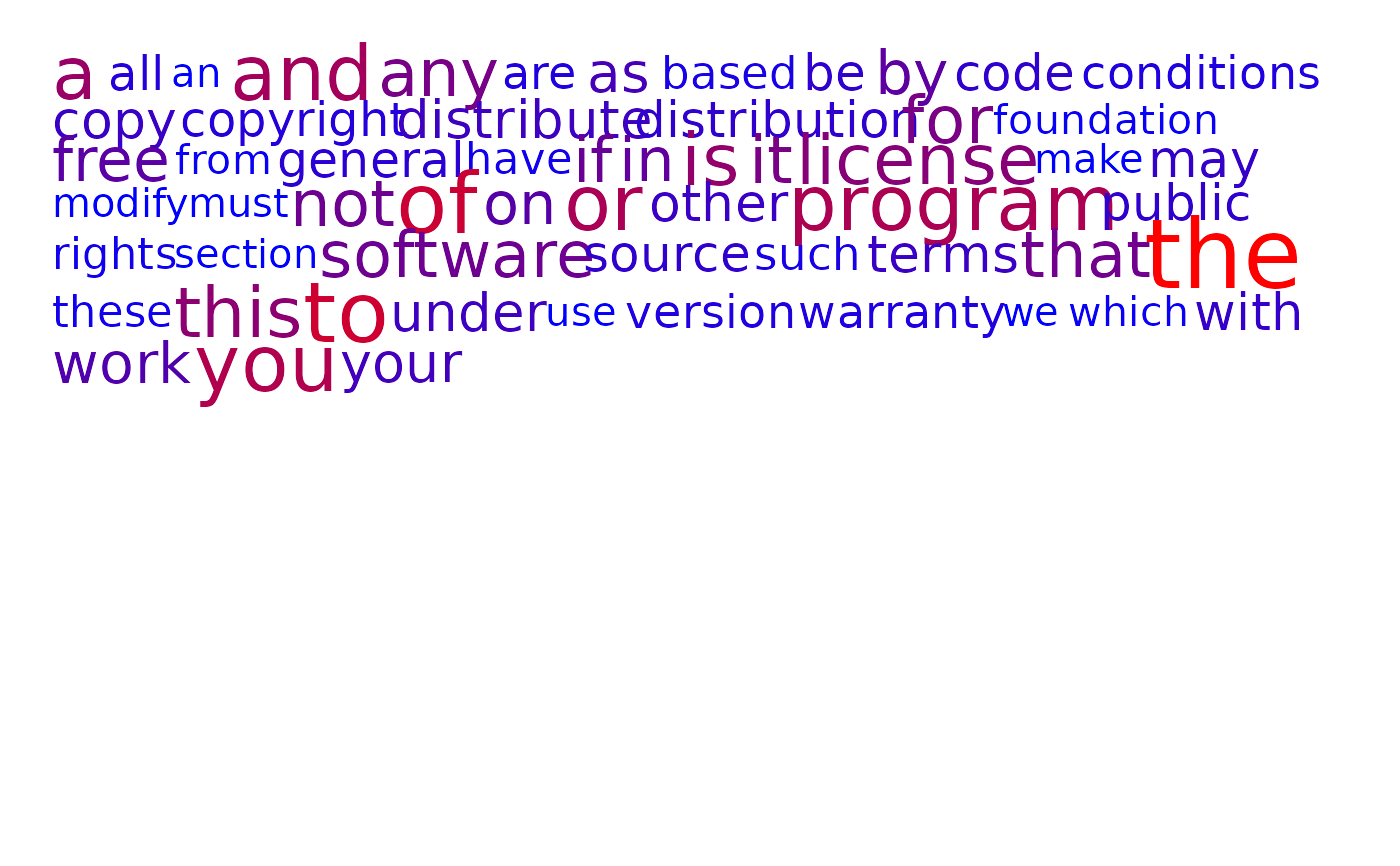
# remove infrequent words
wt <- table(w)
wt <- log(wt[wt > 8])
cloud(wt, col = col.br(wt, fit=TRUE))
#> Warning: argument 1 does not name a graphical parameter
# remove infrequent words
wt <- table(w)
wt <- log(wt[wt > 8])
cloud(wt, col = col.br(wt, fit=TRUE))
 #> Warning: argument 1 does not name a graphical parameter